OKR Analytics
Monitor what is the status and progress of your IMPACT OKRs over time. Stay up to date about the team progress and take proactive actions when necessary.
OKR progress is calculated as the weighted average (mean) of the Key result progress.
The team OKR progress is calculated as an average of all OKRs assigned to the team in the given Objective cycle
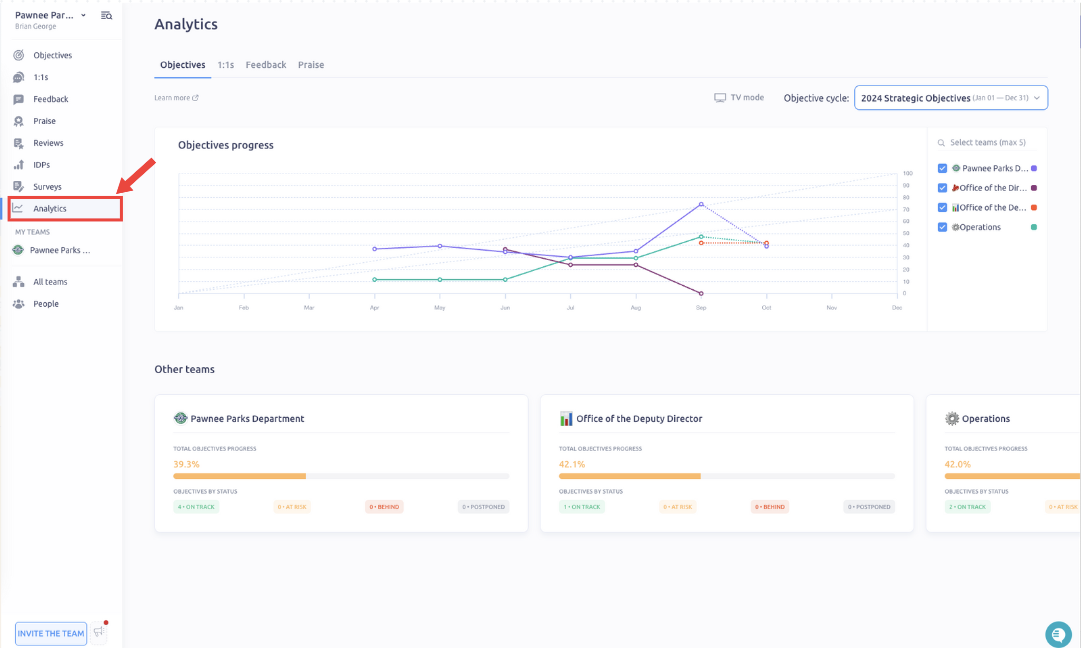
Historical OKR progress
Go to the “Dashboard” tab to view the OKR progress over time.
We take the snapshot every Sunday at 00:00 of all the team progress in all active Objective cycles. Additionally, we take the snapshot on the last day of the month. And present it to you in the historical chart.
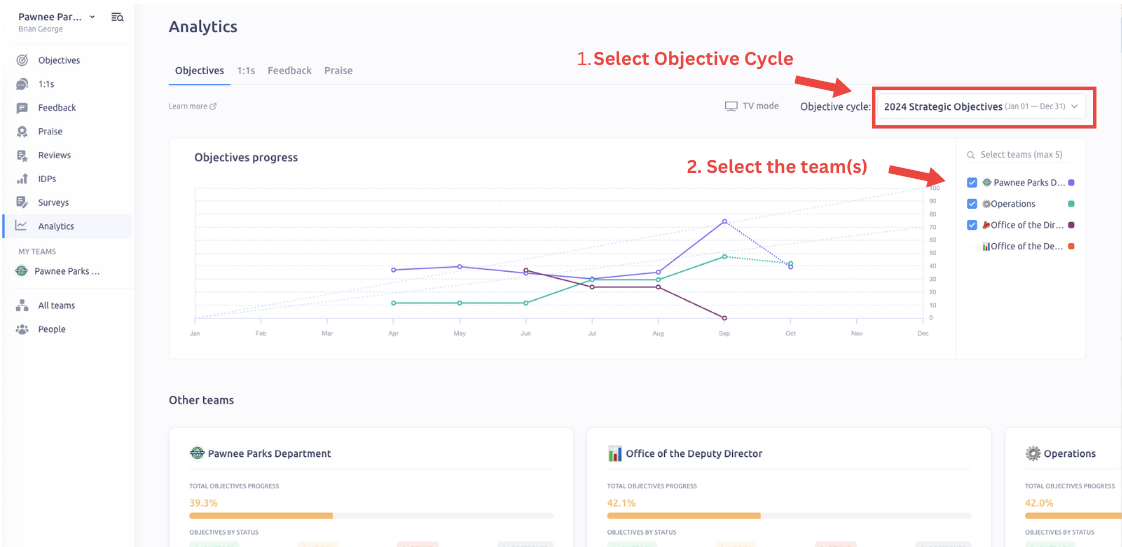
Start by selecting the Objective cycle you want to view the progress for and up to 5 teams.
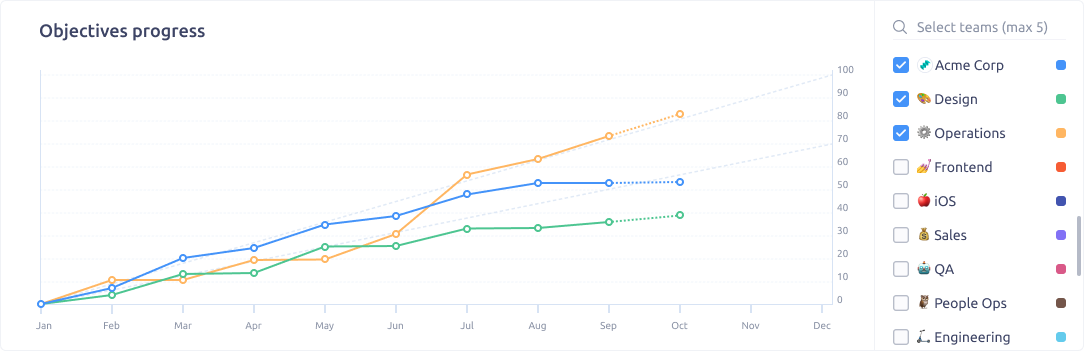
The bottom scale is:
- In weeks (W1, W2, etc.) for Objective cycles <= 6 months.
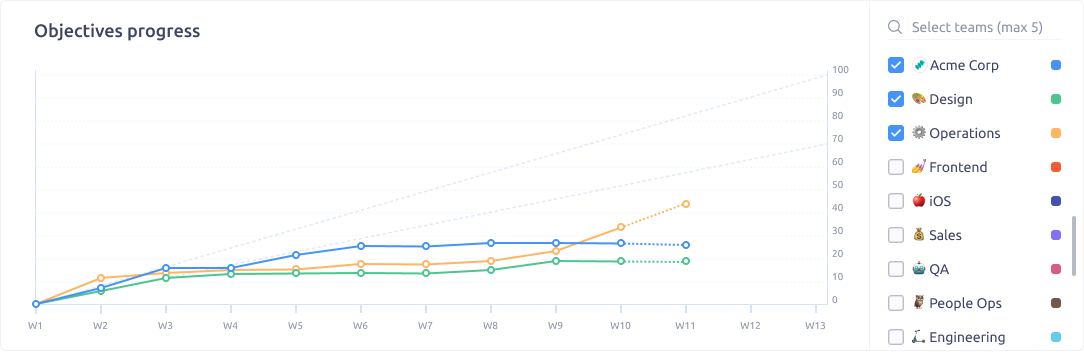
- In months (Jan, Feb, etc.) for Objective cycles > 6 months.
Hover over the chart to view the tooltip with more info:
- Team name and color;
- Time period;
- Exact progress;
- The difference compared to the previous progress;
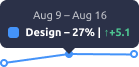
The current time period (week or month) is highlighted with the dashed line. It might change as you update the progress of the OKRs. The progress of the previous periods won’t change.
👆 Note: The Dashboard is visible to all users. It’s a great way to ensure transparency and visibility of the performance of each team.
Current OKR progress snapshot
Below the chart, you can see the progress at this time of:
- Your own Objectives
- Company Objectives
- Your team Objectives
- All the other teams’ Objectives
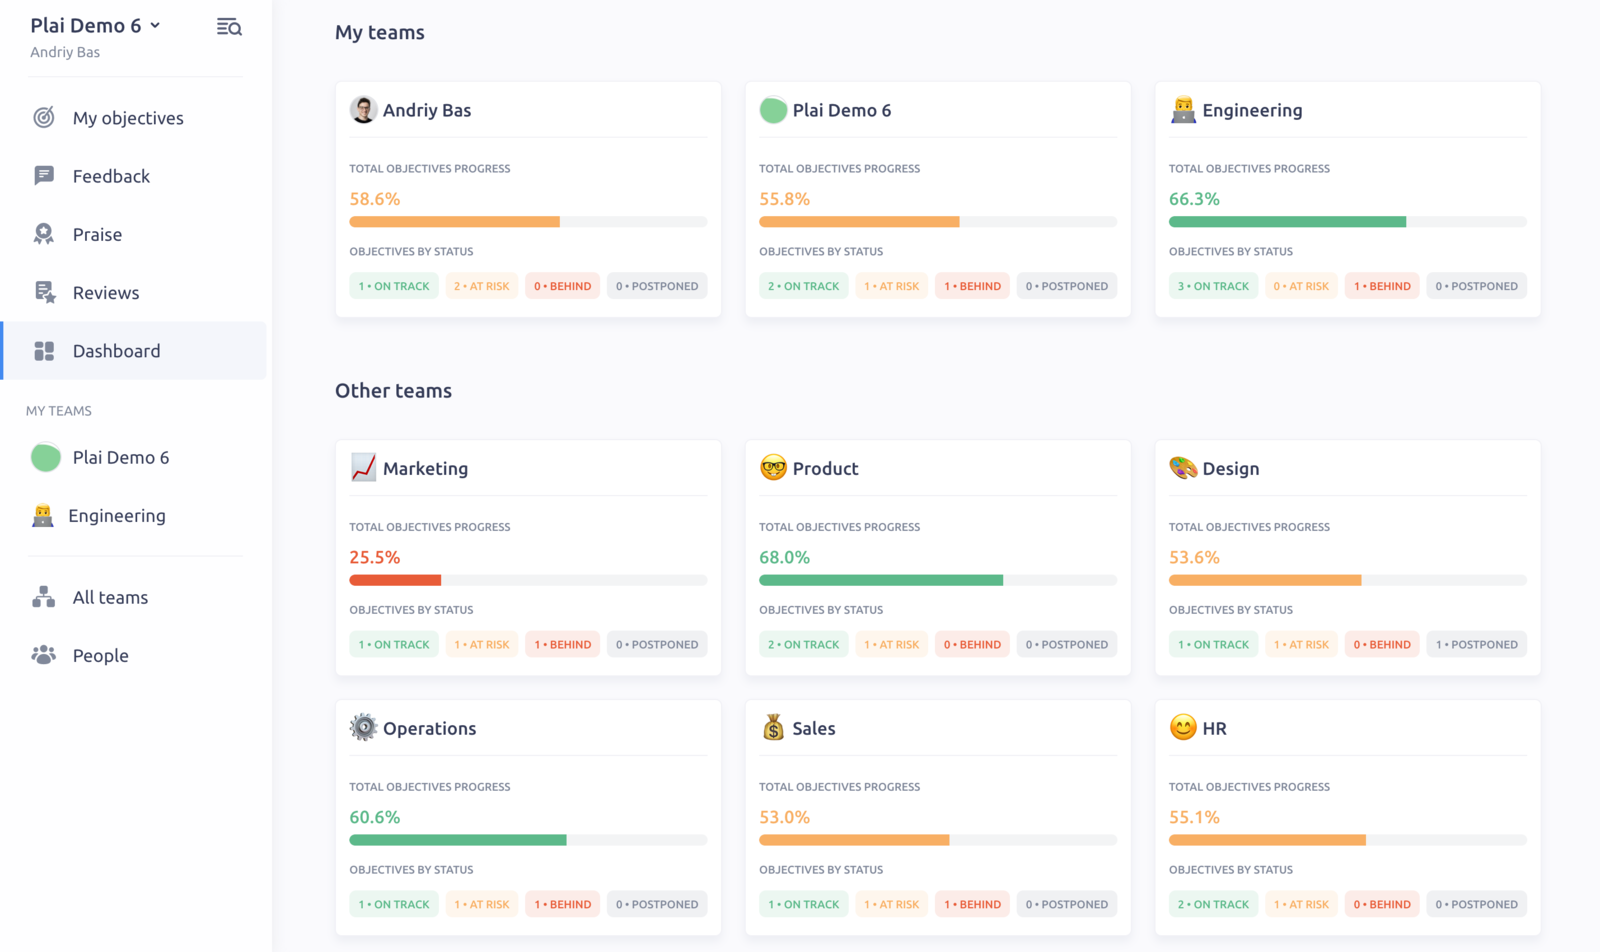
Check how many Objectives are in each status and stay up to date with the progress of the whole company.
Updated on: 07/05/2026
Thank you!